Exhibit 99.4
SELECTED HISTORICAL FINANCIAL INFORMATION OF AEII/WPT
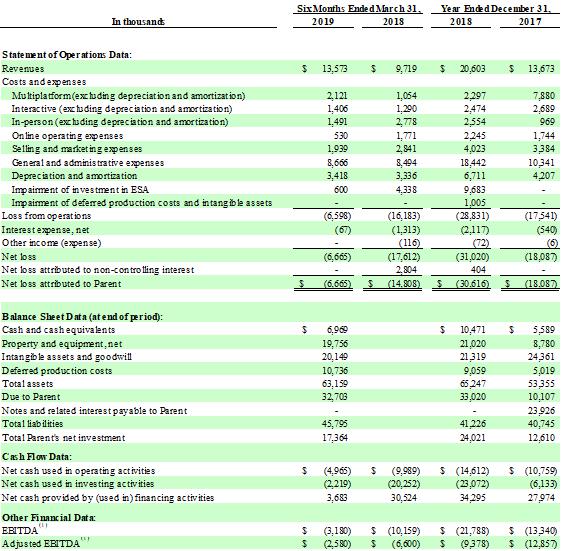
The following table shows selected historical combined financial information of the businesses acquired by BRAC for the periods and as of the dates indicated. The selected historical combined financial information as of and for the years ended December 31, 2018 and 2017 was derived from the audited historical combined financial statements of Allied Esports International, Inc. and subsidiaries (“AEII”) and Noble Link Global Limited and its subsidiaries Peerless Media Limited, WPT Distribution Worldwide Limited and WPT Studios Worldwide Limited (“WPT”) and combined (“AEII/WPT”) included elsewhere in this proxy statement. The selected historical interim condensed combined financial information of AEII/WPT as of June 30, 2019 and for the six months ended June 30, 2019 and 2018 was derived from the unaudited interim condensed combined financial statements of AEII/WPT included elsewhere in this Current Report on Form 8-K.
AEII/WPT’s historical results are not necessarily indicative of future operating results. The selected combined financial information should be read in conjunction with “Management’s Discussion and Analysis of Financial Condition and Results of Operations of AEII/WPT,” as well as the historical combined financial statements of AEII/WPT and accompanying notes included elsewhere in this Current Report on Form 8-K and in the Proxy Statement.

| (1) | EBITDA and Adjusted EBITDA are non-GAAP financial measures. For a definition of EBITDA and Adjusted EBITDA and a reconciliation of EBITDA and Adjusted EBITDA to net income, see "- Non-GAAP Financial Measures" below. |
| 1 |
Non-GAAP Financial Measures
EBITDA and Adjusted EBITDA are non-GAAP financial measures and should not be considered as a substitute for net income (loss), operating income (loss) or any other performance measure derived in accordance with United States generally accepted accounting principles (“GAAP”) or as an alternative to net cash provided by operating activities as a measure of AEII/WPT’s profitability or liquidity. AEII/WPT’s management believes EBITDA and Adjusted EBITDA are useful because they allow external users of its financial statements, such as industry analysts, investors, lenders and rating agencies, to more effectively evaluate its operating performance, compare the results of its operations from period to period and against AEII/WPT’s peers without regard to AEII/WPT’s financing methods, hedging positions or capital structure and because it highlights trends in AEII/WPT’s business that may not otherwise be apparent when relying solely on GAAP measures. AEII/WPT presents EBITDA and Adjusted EBITDA because it believes EBITDA and Adjusted EBITDA are important supplemental measures of its performance that are frequently used by others in evaluating companies in its industry. Because EBITDA and Adjusted EBITDA exclude some, but not all, items that affect net income (loss) and may vary among companies, the EBITDA and Adjusted EBITDA AEII/WPT presents may not be comparable to similarly titled measures of other companies. AEII/WPT defines EBITDA as earnings before interest, income taxes, depreciation and amortization of intangibles. AEII/WPT defines Adjusted EBITDA as EBITDA excluding stock-based compensation and impairment losses.
The following table presents a reconciliation of EBITDA and Adjusted EBITDA from net loss, AEII/WPT’s most directly comparable financial measure calculated and presented in accordance with GAAP.
| Six Months Ended June 30, | Year Ended December 31, | |||||||||||||||
| (In thousands) | 2019 | 2018 | 2018 | 2017 | ||||||||||||
| Net loss attributed to parent | $ | (6,665 | ) | $ | (14,808 | ) | $ | (30,616 | ) | $ | (18,087 | ) | ||||
| Interest expense, net | 67 | 1,313 | 2,117 | 540 | ||||||||||||
| Depreciation and amortization | 3,418 | 3,336 | 6,711 | 4,207 | ||||||||||||
| EBITDA | (3,180 | ) | (10,159 | ) | (21,788 | ) | (13,340 | ) | ||||||||
| Stock-based compensation(a) | – | (779 | ) | (766 | ) | 483 | ||||||||||
| Impairment of investment in ESA(b) | 600 | 4,338 | 9.683 | – | ||||||||||||
| Subsidiary loss during consolidation period(c) | – | – | 1,839 | – | ||||||||||||
| Impairment of deferred production costs and intangible assets(d) | – | – | 1,005 | – | ||||||||||||
| Writeoffs of capitalized software costs(e) | – | – | 649 | – | ||||||||||||
| Adjusted EBITDA | $ | (2,580 | ) | $ | (6,600 | ) | $ | (9,378 | ) | $ | (12,857 | ) | ||||
| (a) | Represents non-cash stock-based compensation. |
| (b) | Represents a non-cash loss with respect to the deconsolidation of an equity investment of AEII. |
| (c) | Represents subsidiary loss during consolidation period of equity investment of AEII. |
| (d) | Represents impairment of deferred production costs and intangible assets. |
| (e) | Represents non-cash write-offs of internally developed software. |
| 2 |