Exhibit 99.2

September 2020 1
This presentation includes “forward - looking statements” under Section 27 A of the Securities Act of 1933 , as amended, and Section 21 E of the Securities Exchange Act of 1934 , as amended . Allied Esports Entertainment, Inc’s (the “Company”) a ctual results may differ from its expectations, estimates and projections and , consequently, you should not rely on these forward looking statements as predictions of future events . Words such as “expect,” “estimate,” “project,” “budget,” “forecast,” “anticipate,” “intend,” “plan,” “may,” “will,” “could,” “should,” “believe,” “predict,” “potential,” “continue,” and similar expressions are intended to identify such forward - looking statements . These forward - looking statements involve significant risks and uncertainties that could cause the actual results to differ materially from the expected results . Most of these factors are outside the Company’s control and are difficult to predict . Factors that may cause such differences include, but are not limited to : ( 1 ) the ability of the C ompany to grow and manage growth profitably, maintain relationships with suppliers and obtain adequate supply of products and retain its key employees ; ( 2 ) general economic conditions and those particularly affecting the industries in which the Company operates ; ( 3 ) changes in applicable laws or regulations ; ( 4 ) the possibility that the C ompany may be adversely affected by other economic, business, and/or competitive factors ; and ( 5 ) other risks and uncertainties to be indicated from time to time in the Company’s filings with the Securities and Exchange Commission (the “SEC”) and the risks identified in the Company’s annual report on Form 10 - K for the year ended December 31 , 2019 , as amended . T he foregoing list of factors is not exclusive , and r eaders should not place undue reliance upon any forward - looking statements, which speak only as of the date of this presentation . The Company does not undertake or accept any obligation or undertaking to release publicly any updates or revisions to any forward - looking statements to reflect any change in its expectations or any change in events, conditions or circumstances on which any such statement is based . Some of the financial information and data contained herein is unaudited and does not conform to SEC R egulation S - X . Furthermore, it includes certain financial information (Adjusted EBITDA) not derived in accordance with United States Generally Accepted Accounting Principles (“GAAP”) . The Company believe s that the presentation of these non - GAAP measurements provides information that is useful as it indicates more clearly the ability of the Company to meet capital expenditures and working capital requirements and otherwise meet its obligation s as they become due . However, this should not be construed to replace GAAP figures , and such information and data may be adjusted and presented differently in the Company’s filings . FORWARD LOOKING STATEMENTS Copyright © 2020 Allied Esports Entertainment, Inc. – All Rights Reserved 2
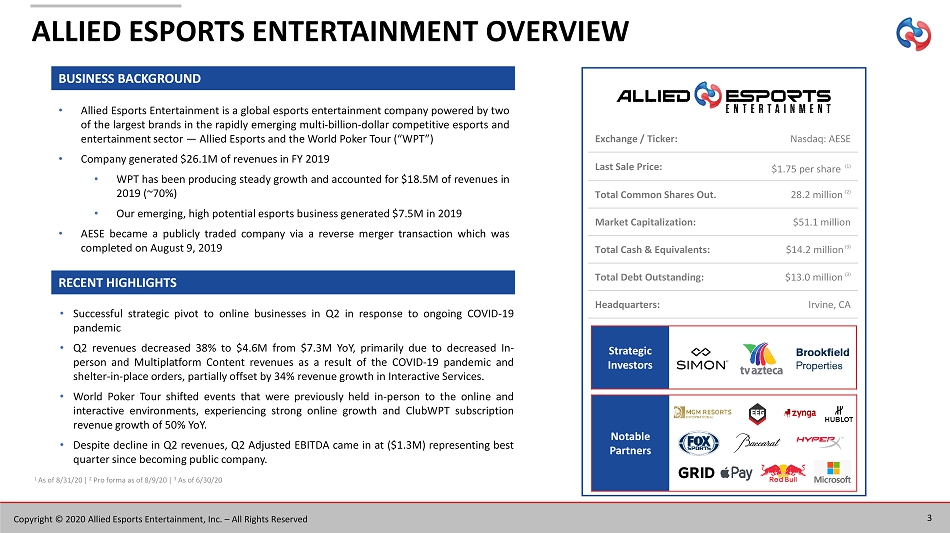
• Allied Esports Entertainment is a global esports entertainment company powered by two of the largest brands in the rapidly emerging multi - billion - dollar competitive esports and entertainment sector — Allied Esports and the World Poker Tour (“WPT”) • Company generated $ 26 . 1 M of revenues in FY 2019 • WPT has been producing steady growth and accounted for $ 18 . 5 M of revenues in 2019 (~ 70 % ) • Our emerging, high potential esports business generated $ 7 . 5 M in 2019 • AESE became a publicly traded company via a reverse merger transaction which was completed on August 9 , 2019 ALLIED ESPORTS ENTERTAINMENT OVERVIEW BUSINESS BACKGROUND • Successful strategic pivot to online businesses in Q 2 in response to ongoing COVID - 19 pandemic • Q 2 revenues decreased 38 % to $ 4 . 6 M from $ 7 . 3 M YoY, primarily due to decreased In - person and Multiplatform Content revenues as a result of the COVID - 19 pandemic and shelter - in - place orders, partially offset by 34 % revenue growth in Interactive Services . • World Poker Tour shifted events that were previously held in - person to the online and interactive environments, experiencing strong online growth and ClubWPT subscription revenue growth of 50 % YoY . • Despite decline in Q 2 revenues, Q 2 Adjusted EBITDA came in at ( $ 1 . 3 M) representing best quarter since becoming public company . RECENT HIGHLIGHTS Exchange / Ticker: Nasdaq: AESE Last Sale Price: $1.75 per share (1) Total Common Shares Out. 28.2 million (2) Market Capitalization: $51.1 million Total Cash & Equivalents: $14.2 million (3) Total Debt Outstanding: $13.0 million (3) Headquarters: Irvine, CA Strategic Investors Notable Partners 1 As of 8/31/20 | 2 Pro forma as of 8/9/20 | 3 As of 6/30/20 3 Copyright © 2020 Allied Esports Entertainment, Inc. – All Rights Reserved
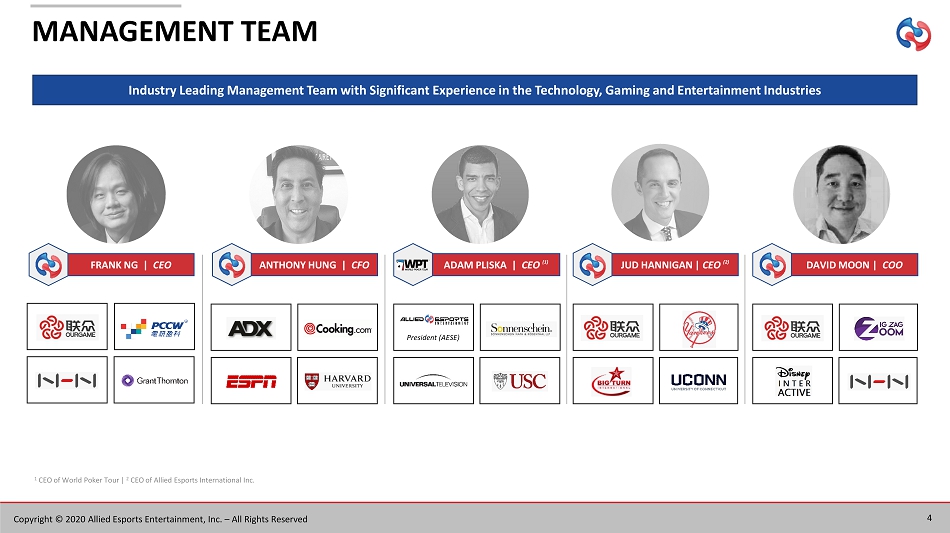
MANAGEMENT TEAM FRANK NG | CEO Industry Leading Management Team with Significant Experience in the Technology, Gaming and Entertainment Industries 4 ANTHONY HUNG | CFO ADAM PLISKA | CEO (1) President (AESE) JUD HANNIGAN | CEO (2) DAVID MOON | COO 1 CEO of World Poker Tour | 2 CEO of Allied Esports International Inc. Copyright © 2020 Allied Esports Entertainment, Inc. – All Rights Reserved
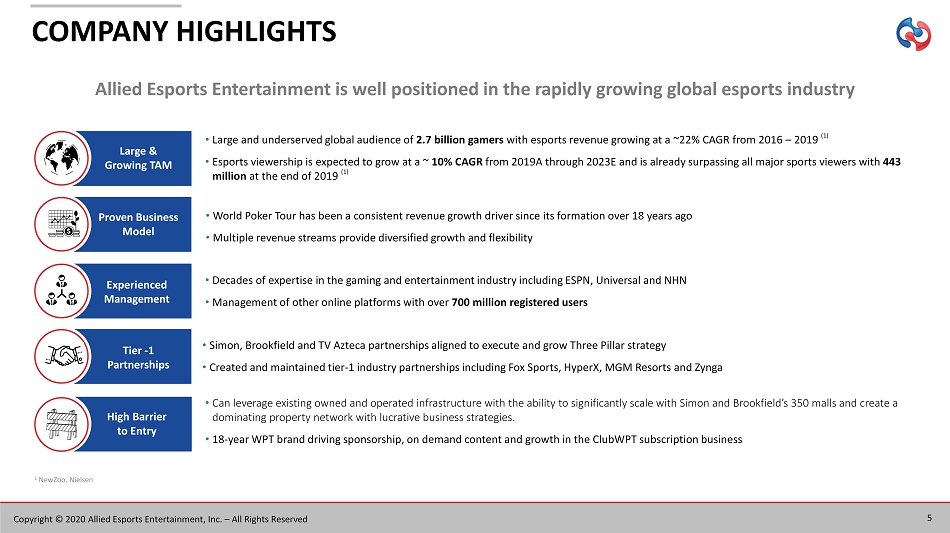
COMPANY HIGHLIGHTS • Large and underserved global audience of 2.7 billion gamers with esports revenue growing at a ~22% CAGR from 2016 – 2019 (1) • Esports viewership is expected to grow at a ~ 10% CAGR from 2019A through 2023E and is already surpassing all major sports viewers with 443 million at the end of 2019 (1) • Decades of expertise in the gaming and entertainment industry including ESPN, Universal and NHN • Management of other online platforms with over 700 million registered users • Can leverage existing owned and operated infrastructure with the ability to significantly scale with Simon and Brookfield’s 3 50 malls and create a dominating property network with lucrative business strategies. • 18 - year WPT brand driving sponsorship, on demand content and growth in the ClubWPT subscription business • Simon, Brookfield and TV Azteca partnerships aligned to execute and grow Three Pillar strategy • Created and maintained tier - 1 industry partnerships including Fox Sports, HyperX, MGM Resorts and Zynga Allied Esports Entertainment is well positioned in the rapidly growing global esports industry • World Poker Tour has been a consistent revenue growth driver since its formation over 18 years ago • Multiple revenue streams provide diversified growth and flexibility Large & Growing TAM Experienced Management Proven Business Model High Barrier to Entry Tier - 1 Partnerships 5 Copyright © 2020 Allied Esports Entertainment, Inc. – All Rights Reserved 1 NewZoo , Nielsen
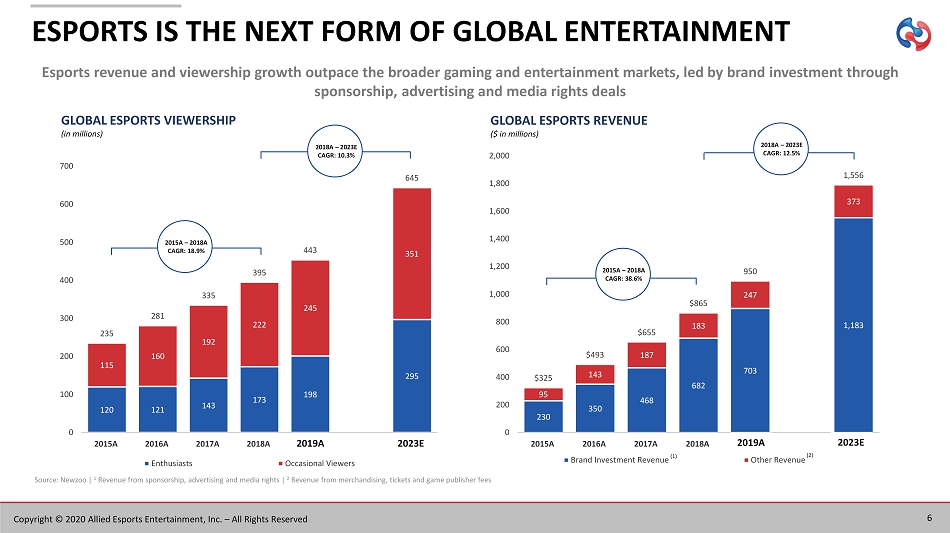
Source: Newzoo | 1 Revenue from sponsorship, advertising and media rights | 2 Revenue from merchandising, tickets and game publisher fees 120 121 143 173 198 295 115 160 192 222 245 351 235 281 335 395 443 645 0 100 200 300 400 500 600 700 2015A 2016A 2017A 2018A 2019E 2022E Enthusiasts Occasional Viewers GLOBAL ESPORTS VIEWERSHIP (in millions) 230 350 468 682 703 1,183 95 143 187 183 247 373 $325 $493 $655 $865 950 1,556 0 200 400 600 800 1,000 1,200 1,400 1,600 1,800 2,000 2015A 2016A 2017A 2018A 2019E 2022E Brand Investment Revenue Other Revenue (2) (1) GLOBAL ESPORTS REVENUE ($ in millions) Esports revenue and viewership growth outpace the broader gaming and entertainment markets, led by brand investment through sponsorship, advertising and media rights deals 2015A – 2018A CAGR: 38.6% 2018A – 2023E CAGR: 12.5% 2015A – 2018A CAGR: 18.9% 2018A – 2023E CAGR: 10.3% 6 Copyright © 2020 Allied Esports Entertainment, Inc. – All Rights Reserved ESPORTS IS THE NEXT FORM OF GLOBAL ENTERTAINMENT 2019A 2019A 2023E 2023E
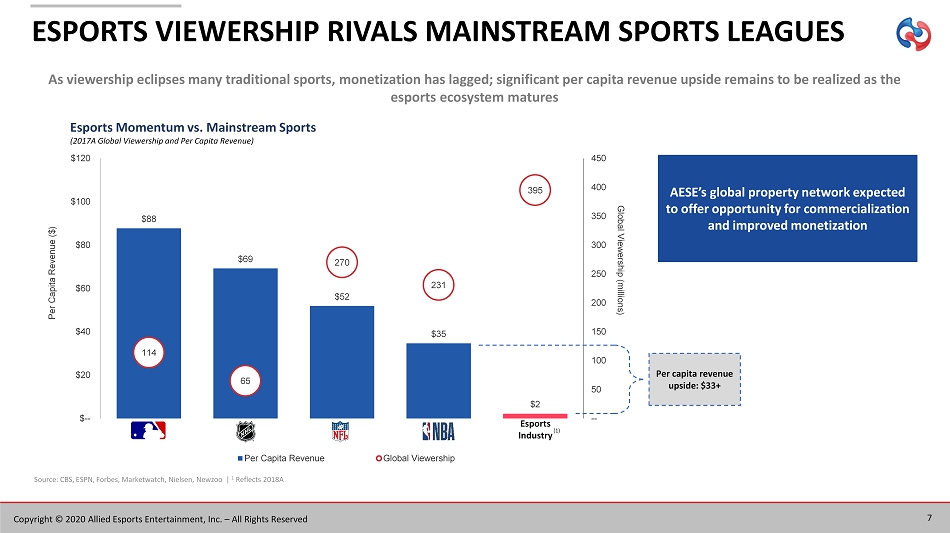
AESE’s global property network expected to offer opportunity for commercialization and improved monetization $88 $69 $52 $35 $2 114 65 270 231 395 -- 50 100 150 200 250 300 350 400 450 $-- $20 $40 $60 $80 $100 $120 Global Viewership (millions) Per Capita Revenue ($) Per Capita Revenue Global Viewership Source: CBS, ESPN, Forbes, Marketwatch , Nielsen, Newzoo | 1 Reflects 2018A Per capita revenue upside: $33+ Esports Industry (1) Esports Momentum vs. Mainstream Sports (2017A Global Viewership and Per Capita Revenue) As viewership eclipses many traditional sports, monetization has lagged; significant per capita revenue upside remains to be rea lized as the esports ecosystem matures 7 Copyright © 2020 Allied Esports Entertainment, Inc. – All Rights Reserved ESPORTS VIEWERSHIP RIVALS MAINSTREAM SPORTS LEAGUES
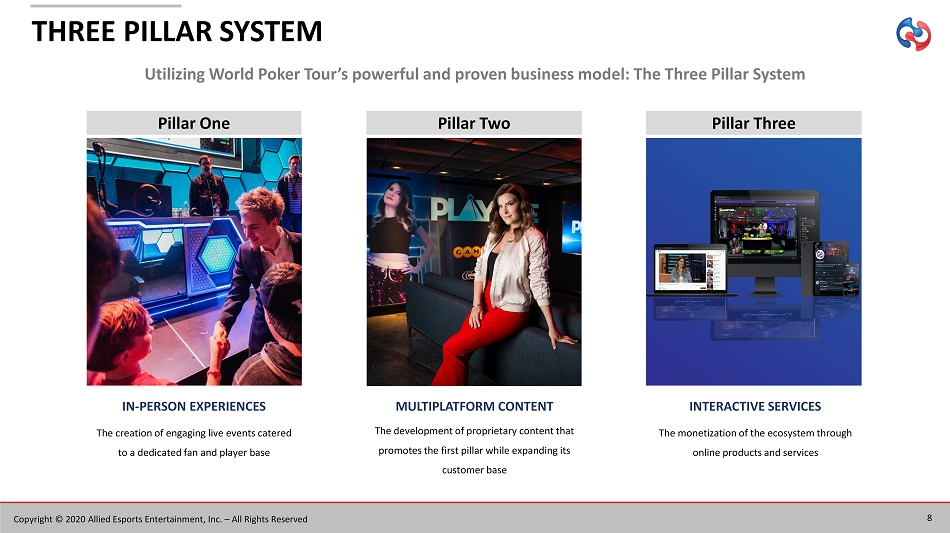
THREE PILLAR SYSTEM MULTIPLATFORM CONTENT The development of proprietary content that promotes the first pillar while expanding its customer base INTERACTIVE SERVICES The monetization of the ecosystem through online products and services IN - PERSON EXPERIENCES The creation of engaging live events catered to a dedicated fan and player base Pillar One Pillar Two Pillar Three Utilizing World Poker Tour’s powerful and proven business model: The Three Pillar System 8 Copyright © 2020 Allied Esports Entertainment, Inc. – All Rights Reserved
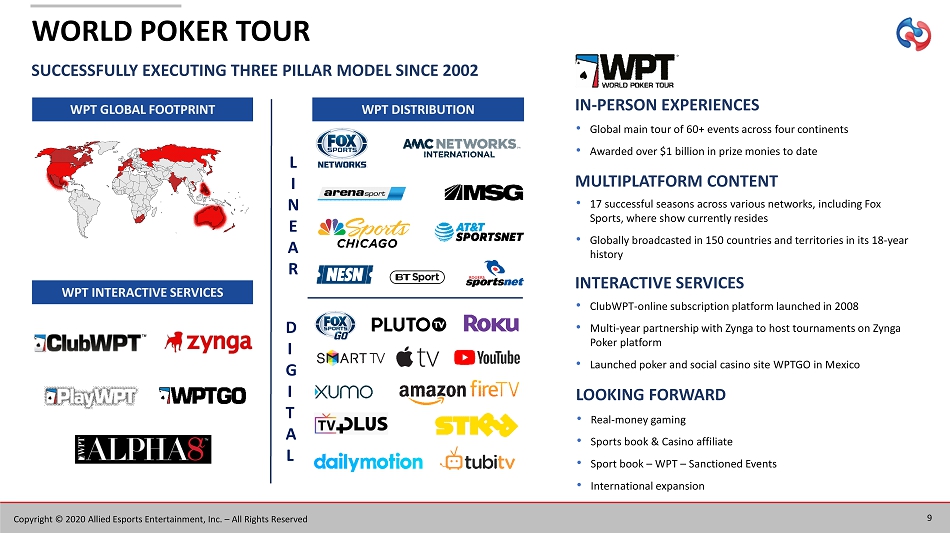
WPT GLOBAL FOOTPRINT SUCCESSFULLY EXECUTING THREE PILLAR MODEL SINCE 2002 • Global main tour of 60+ events across four continents • Awarded over $1 billion in prize monies to date • 17 successful seasons across various networks, including Fox Sports, where show currently resides • Globally broadcasted in 150 countries and territories in its 18 - year history • ClubWPT - online subscription platform launched in 2008 • Multi - year partnership with Zynga to host tournaments on Zynga Poker platform • Launched poker and social casino site WPTGO in Mexico WORLD POKER TOUR IN - PERSON EXPERIENCES MULTIPLATFORM CONTENT INTERACTIVE SERVICES WPT DISTRIBUTION WPT INTERACTIVE SERVICES L I N E A R D I G I T A L • Real - money gaming • Sports book & Casino affiliate • Sport book – WPT – Sanctioned Events • International expansion LOOKING FORWARD 9 Copyright © 2020 Allied Esports Entertainment, Inc. – All Rights Reserved
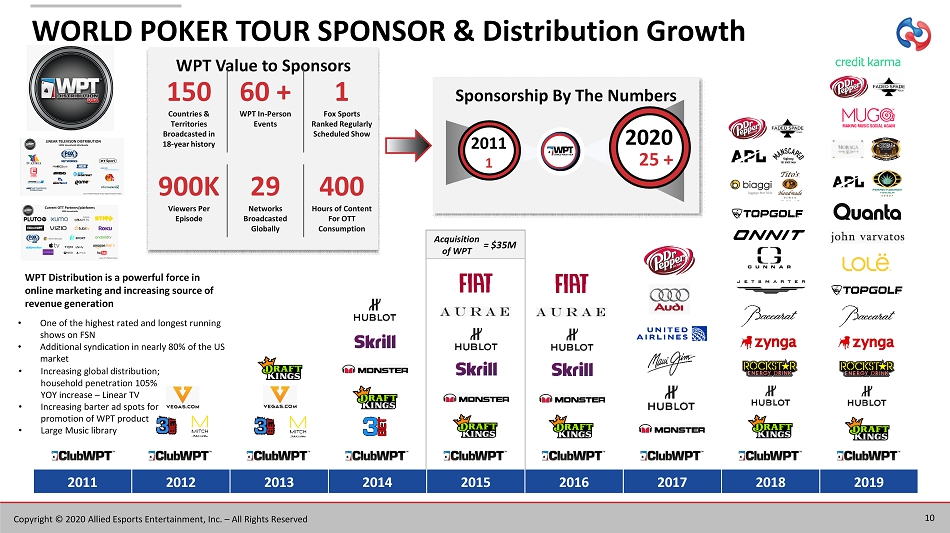
Sponsorship By The Numbers WORLD POKER TOUR SPONSOR & Distribution Growth 10 1 2011 25 + 2020 WPT Value to Sponsors 150 Countries & Territories Broadcasted in 18 - year history 60 + WPT In - Person Events 1 Fox Sports Ranked Regularly Scheduled Show 900K Viewers Per Episode 29 Networks Broadcasted Globally 400 Hours of Content For OTT Consumption 2011 2012 2013 2014 2015 2016 2017 2018 2019 Acquisition of WPT Copyright © 2020 Allied Esports Entertainment, Inc. – All Rights Reserved = $35M WPT Distribution is a powerful force in online marketing and increasing source of revenue generation • Increasing global distribution; household penetration 105% YOY increase – Linear TV • Increasing barter ad spots for promotion of WPT product • Large Music library • One of the highest rated and longest running shows on FSN • Additional syndication in nearly 80% of the US market
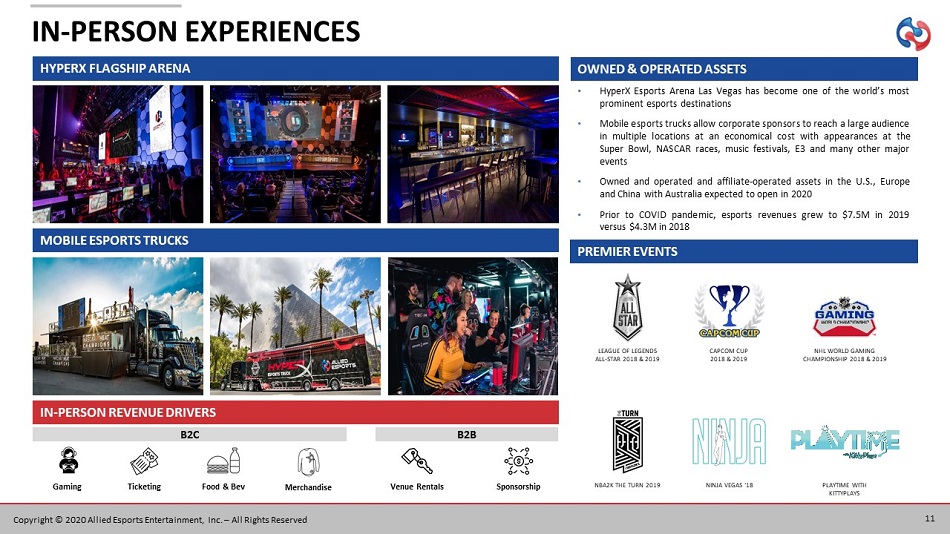
• HyperX Esports Arena Las Vegas has become one of the world’s most prominent esports destinations • Mobile esports trucks allow corporate sponsors to reach a large audience in multiple locations at an economical cost with appearances at the Super Bowl, NASCAR races, music festivals, E 3 and many other major events • Owned and operated and affiliate - operated assets in the U . S . , Europe and China with Australia expected to open in 2020 • Prior to COVID pandemic, esports revenues grew to $ 7 . 5 M in 2019 versus $ 4 . 3 M in 2018 LEAGUE OF LEGENDS ALL - STAR 2018 & 2019 CAPCOM CUP 2018 & 2019 NHL WORLD GAMING CHAMPIONSHIP 2018 & 2019 NBA2K THE TURN 2019 NINJA VEGAS ‘18 PLAYTIME WITH KITTYPLAYS OWNED & OPERATED ASSETS PREMIER EVENTS IN - PERSON EXPERIENCES 11 Copyright © 2020 Allied Esports Entertainment, Inc. – All Rights Reserved HYPERX FLAGSHIP ARENA MOBILE ESPORTS TRUCKS IN - PERSON REVENUE DRIVERS B2C B2B Gaming Ticketing Food & Bev Merchandise Venue Rentals Sponsorship
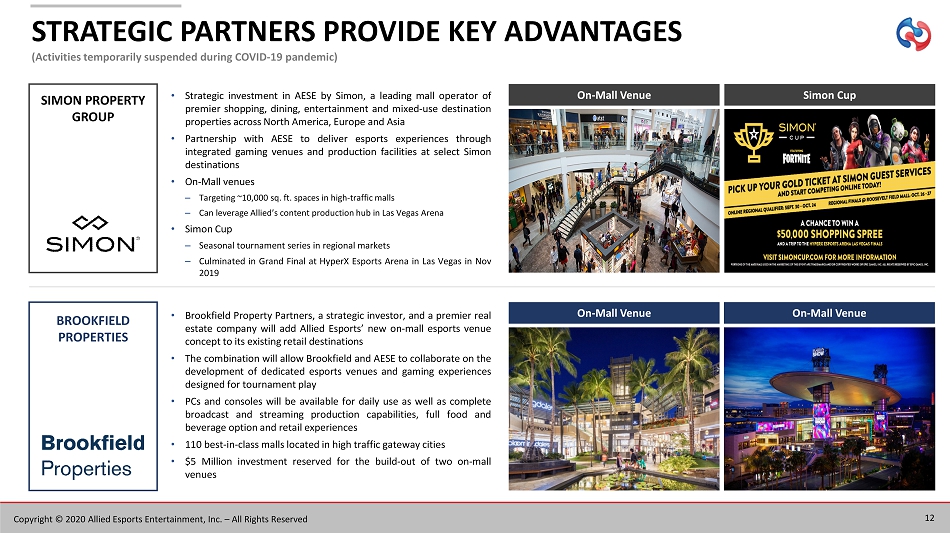
• Strategic investment in AESE by Simon, a leading mall operator of premier shopping, dining, entertainment and mixed - use destination properties across North America, Europe and Asia • Partnership with AESE to deliver esports experiences through integrated gaming venues and production facilities at select Simon destinations • On - Mall venues – Targeting ~ 10 , 000 sq . ft . spaces in high - traffic malls – Can leverage Allied’s content production hub in Las Vegas Arena • Simon Cup – Seasonal tournament series in regional markets – Culminated in Grand Final at HyperX Esports Arena in Las Vegas in Nov 2019 On - Mall Venue STRATEGIC PARTNERS PROVIDE KEY ADVANTAGES (Activities temporarily suspended during COVID - 19 pandemic) 12 • Brookfield Property Partners, a strategic investor, and a premier real estate company will add Allied Esports’ new on - mall esports venue concept to its existing retail destinations • The combination will allow Brookfield and AESE to collaborate on the development of dedicated esports venues and gaming experiences designed for tournament play • PCs and consoles will be available for daily use as well as complete broadcast and streaming production capabilities, full food and beverage option and retail experiences • 110 best - in - class malls located in high traffic gateway cities • $ 5 Million investment reserved for the build - out of two on - mall venues Simon Cup SIMON PROPERTY GROUP BROOKFIELD PROPERTIES On - Mall Venue On - Mall Venue Copyright © 2020 Allied Esports Entertainment, Inc. – All Rights Reserved
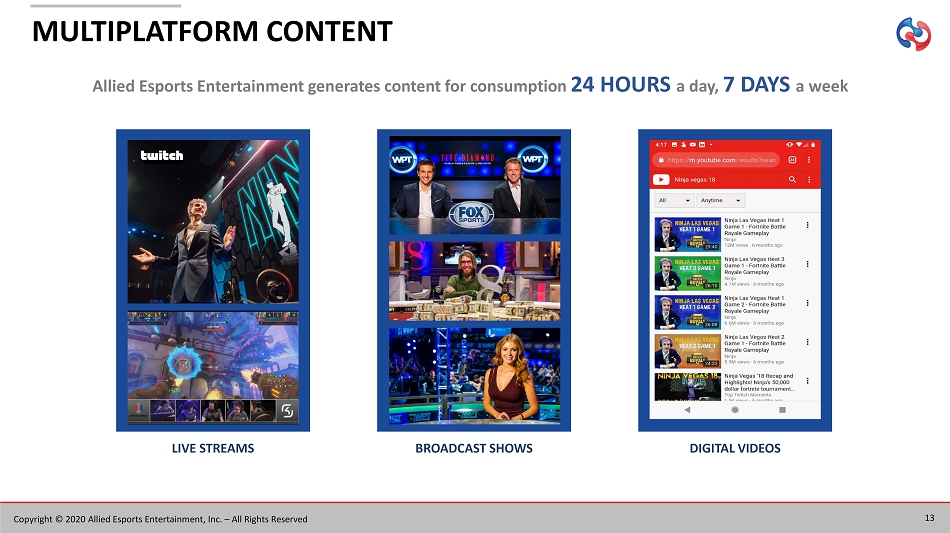
Allied Esports Entertainment generates content for consumption 24 HOURS a day, 7 DAYS a week BROADCAST SHOWS DIGITAL VIDEOS LIVE STREAMS MULTIPLATFORM CONTENT 13 Copyright © 2020 Allied Esports Entertainment, Inc. – All Rights Reserved
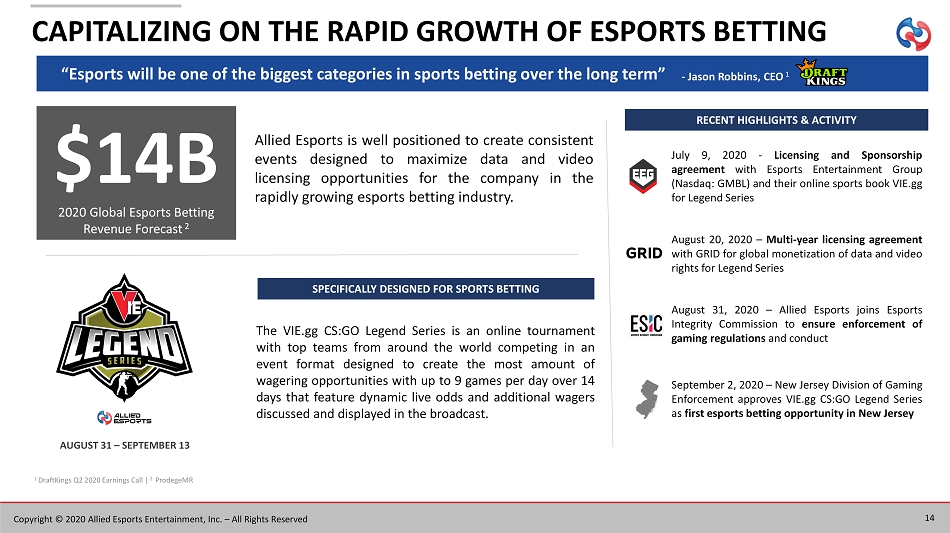
CAPITALIZING ON THE RAPID GROWTH OF ESPORTS BETTING 14 July 9 , 2020 - Licensing and Sponsorship agreement with Esports Entertainment Group (Nasdaq : GMBL) and their online sports book VIE . gg for Legend Series August 20 , 2020 – Multi - year licensing agreement with GRID for global monetization of data and video rights for Legend Series August 31 , 2020 – Allied Esports joins Esports Integrity Commission to ensure enforcement of gaming regulations and conduct September 2 , 2020 – New Jersey Division of Gaming Enforcement approves VIE . gg CS : GO Legend Series as first esports betting opportunity in New Jersey RECENT HIGHLIGHTS & ACTIVITY “Esports will be one of the biggest categories in sports betting over the long term” Copyright © 2020 Allied Esports Entertainment, Inc. – All Rights Reserved - Jason Robbins, CEO 1 1 DraftKings Q2 2020 Earnings Call | 2 ProdegeMR Allied Esports is well positioned to create consistent events designed to maximize data and video licensing opportunities for the company in the rapidly growing esports betting industry . $14B 2020 Global Esports Betting Revenue Forecast 2 The VIE . gg CS : GO Legend Series is an online tournament with top teams from around the world competing in an event format designed to create the most amount of wagering opportunities with up to 9 games per day over 14 days that feature dynamic live odds and additional wagers discussed and displayed in the broadcast . AUGUST 31 – SEPTEMBER 13 SPECIFICALLY DESIGNED FOR SPORTS BETTING
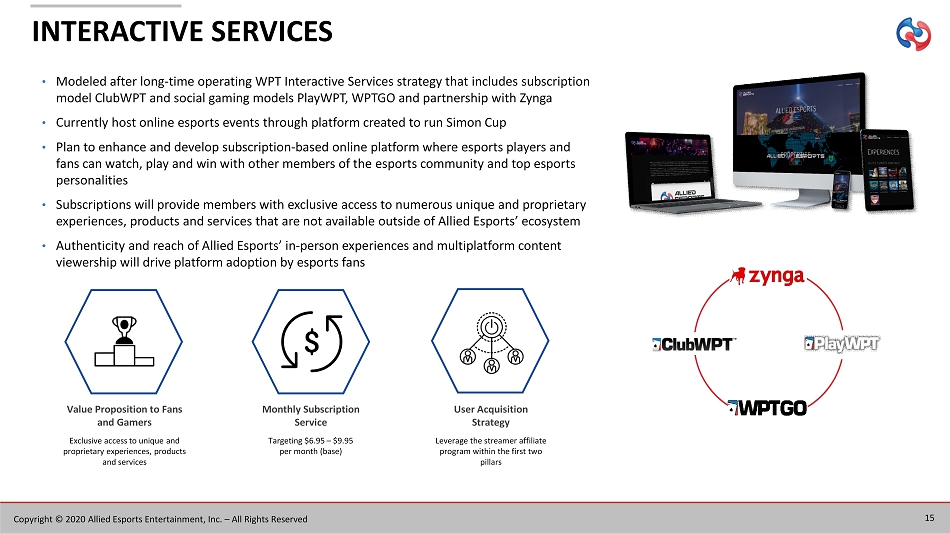
• Modeled after long - time operating WPT Interactive Services strategy that includes subscription model ClubWPT and social gaming models PlayWPT , WPTGO and partnership with Zynga • Currently host online esports events through platform created to run Simon Cup • Plan to enhance and develop subscription - based online platform where esports players and fans can watch, play and win with other members of the esports community and top esports personalities • Subscriptions will provide members with exclusive access to numerous unique and proprietary experiences, products and services that are not available outside of Allied Esports’ ecosystem • Authenticity and reach of Allied Esports’ in - person experiences and multiplatform content viewership will drive platform adoption by esports fans Value Proposition to Fans and Gamers Monthly Subscription Service User Acquisition Strategy Exclusive access to unique and proprietary experiences, products and services Targeting $6.95 – $9.95 per month (base) Leverage the streamer affiliate program within the first two pillars INTERACTIVE SERVICES 15 Copyright © 2020 Allied Esports Entertainment, Inc. – All Rights Reserved
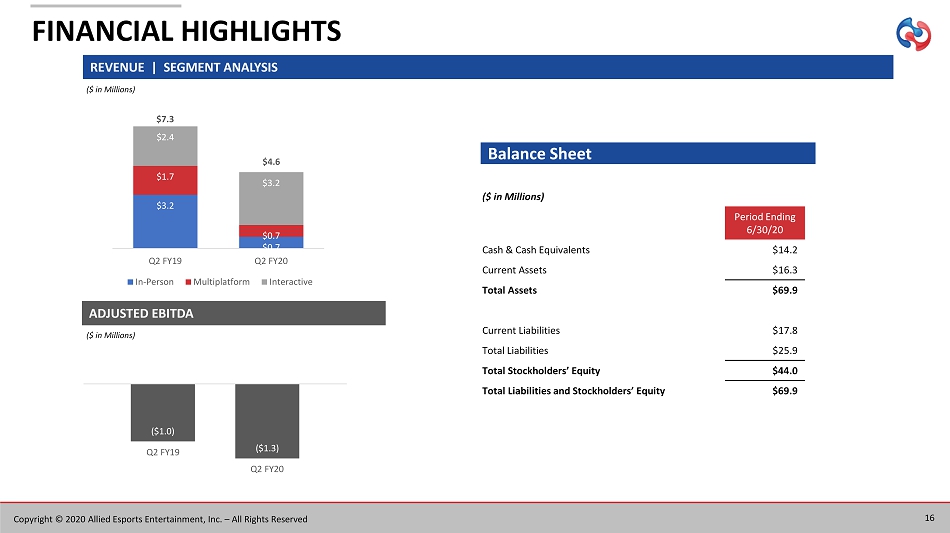
FINANCIAL HIGHLIGHTS ADJUSTED EBITDA REVENUE | SEGMENT ANALYSIS ($ in Millions) ($ in Millions) 16 Copyright © 2020 Allied Esports Entertainment, Inc. – All Rights Reserved $3.2 $0.7 $1.7 $0.7 $2.4 $3.2 Q2 FY19 Q2 FY20 In-Person Multiplatform Interactive $7.3 $4.6 ($1.0) ($1.3) Q2 FY19 Q2 FY20 ($ in Millions) Period Ending 6/30/20 Cash & Cash Equivalents $14.2 Current Assets $16.3 Total Assets $69.9 Current Liabilities $17.8 Total Liabilities $25.9 Total Stockholders’ Equity $44.0 Total Liabilities and Stockholders’ Equity $69.9 Balance Sheet
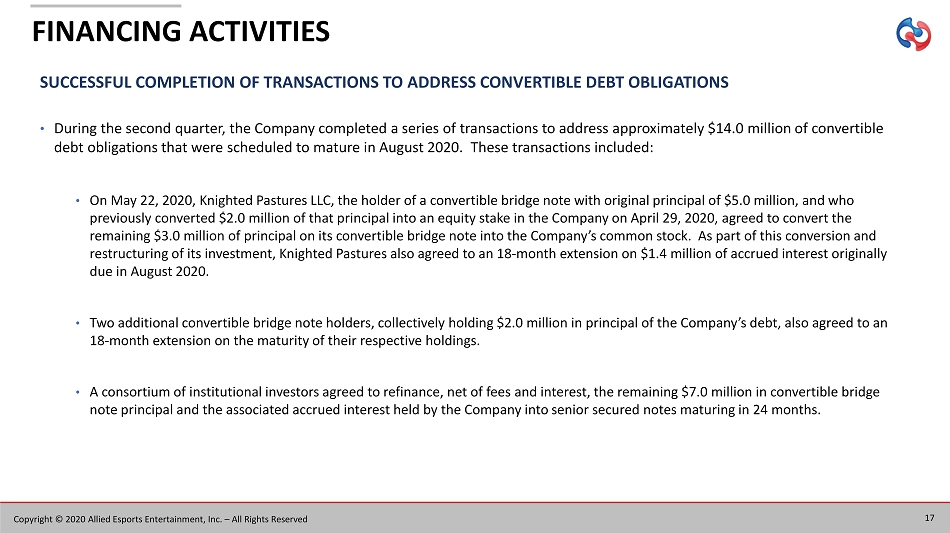
SUCCESSFUL COMPLETION OF TRANSACTIONS TO ADDRESS CONVERTIBLE DEBT OBLIGATIONS • During the second quarter, the Company completed a series of transactions to address approximately $14.0 million of convertib le debt obligations that were scheduled to mature in August 2020. These transactions included: • On May 22, 2020, Knighted Pastures LLC, the holder of a convertible bridge note with original principal of $5.0 million, and who previously converted $2.0 million of that principal into an equity stake in the Company on April 29, 2020, agreed to convert the remaining $3.0 million of principal on its convertible bridge note into the Company’s common stock. As part of this conversi on and restructuring of its investment, Knighted Pastures also agreed to an 18 - month extension on $1.4 million of accrued interest orig inally due in August 2020. • Two additional convertible bridge note holders, collectively holding $2.0 million in principal of the Company’s debt, also ag ree d to an 18 - month extension on the maturity of their respective holdings. • A consortium of institutional investors agreed to refinance, net of fees and interest, the remaining $7.0 million in converti ble bridge note principal and the associated accrued interest held by the Company into senior secured notes maturing in 24 months. FINANCING ACTIVITIES 17 Copyright © 2020 Allied Esports Entertainment, Inc. – All Rights Reserved
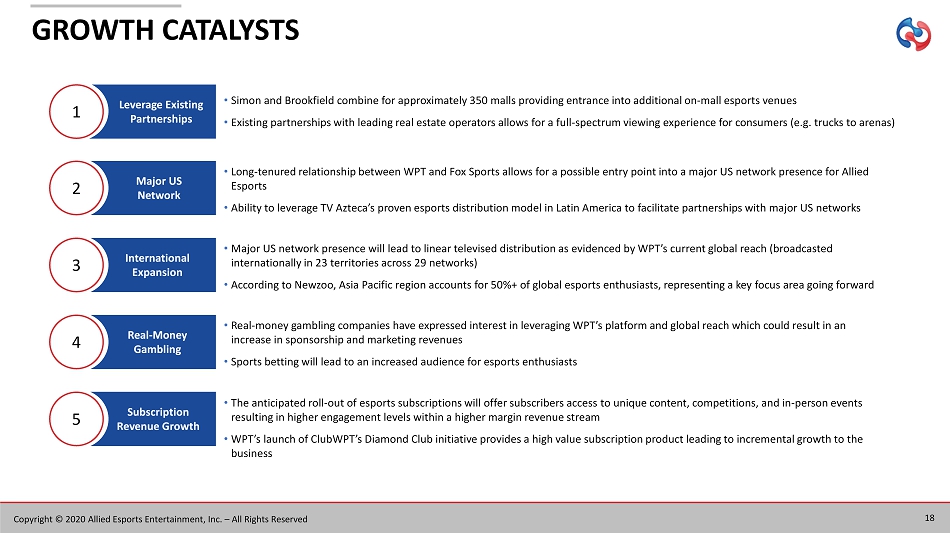
GROWTH CATALYSTS 18 • Long - tenured relationship between WPT and Fox Sports allows for a possible entry point into a major US network presence for Alli ed Esports • Ability to leverage TV Azteca’s proven esports distribution model in Latin America to facilitate partnerships with major US n etw orks Major US Network 2 • Major US network presence will lead to linear televised distribution as evidenced by WPT’s current global reach (broadcasted internationally in 23 territories across 29 networks) • According to Newzoo , Asia Pacific region accounts for 50%+ of global esports enthusiasts, representing a key focus area going forward International Expansion 3 • Real - money gambling companies have expressed interest in leveraging WPT’s platform and global reach which could result in an increase in sponsorship and marketing revenues • Sports betting will lead to an increased audience for esports enthusiasts Real - Money Gambling 4 • The anticipated roll - out of esports subscriptions will offer subscribers access to unique content, competitions, and in - person e vents resulting in higher engagement levels within a higher margin revenue stream • WPT’s launch of ClubWPT’s Diamond Club initiative provides a high value subscription product leading to incremental growth to the business Subscription Revenue Growth 5 Copyright © 2020 Allied Esports Entertainment, Inc. – All Rights Reserved • Simon and Brookfield combine for approximately 350 malls providing entrance into additional on - mall esports venues • Existing partnerships with leading real estate operators allows for a full - spectrum viewing experience for consumers (e.g. truck s to arenas) Leverage Existing Partnerships 1
APPENDIX APPENDIX
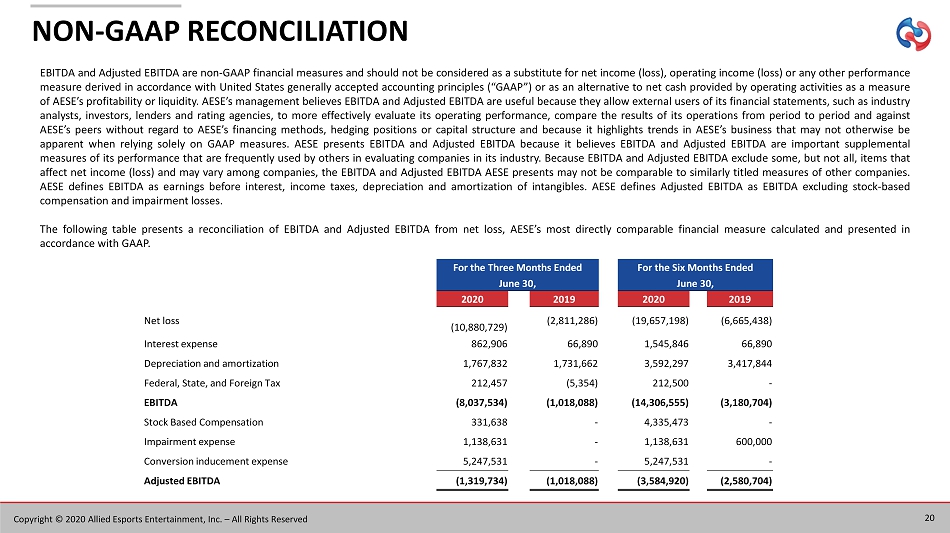
NON - GAAP RECONCILIATION EBITDA and Adjusted EBITDA are non - GAAP financial measures and should not be considered as a substitute for net income (loss), operating income (loss) or any other performance measure derived in accordance with United States generally accepted accounting principles (“GAAP”) or as an alternative to net cash provided by operating activities as a measure of AESE’s profitability or liquidity . AESE’s management believes EBITDA and Adjusted EBITDA are useful because they allow external users of its financial statements, such as industry analysts, investors, lenders and rating agencies, to more effectively evaluate its operating performance, compare the results of its operations from period to period and against AESE’s peers without regard to AESE’s financing methods, hedging positions or capital structure and because it highlights trends in AESE’s business that may not otherwise be apparent when relying solely on GAAP measures . AESE presents EBITDA and Adjusted EBITDA because it believes EBITDA and Adjusted EBITDA are important supplemental measures of its performance that are frequently used by others in evaluating companies in its industry . Because EBITDA and Adjusted EBITDA exclude some, but not all, items that affect net income (loss) and may vary among companies, the EBITDA and Adjusted EBITDA AESE presents may not be comparable to similarly titled measures of other companies . AESE defines EBITDA as earnings before interest, income taxes, depreciation and amortization of intangibles . AESE defines Adjusted EBITDA as EBITDA excluding stock - based compensation and impairment losses . The following table presents a reconciliation of EBITDA and Adjusted EBITDA from net loss, AESE’s most directly comparable financial measure calculated and presented in accordance with GAAP . For the Three Months Ended For the Six Months Ended June 30, June 30, 2020 2019 2020 2019 Net loss (10,880,729) (2,811,286) (19,657,198) (6,665,438) Interest expense 862,906 66,890 1,545,846 66,890 Depreciation and amortization 1,767,832 1,731,662 3,592,297 3,417,844 Federal, State, and Foreign Tax 212,457 (5,354) 212,500 - EBITDA (8,037,534) (1,018,088) (14,306,555) (3,180,704) Stock Based Compensation 331,638 - 4,335,473 - Impairment expense 1,138,631 - 1,138,631 600,000 Conversion inducement expense 5,247,531 - 5,247,531 - Adjusted EBITDA (1,319,734) (1,018,088) (3,584,920) (2,580,704) 20 Copyright © 2020 Allied Esports Entertainment, Inc. – All Rights Reserved
